Press Space to continue
GitHub Data Visualization Lacks Essential Context
Press Space to continue

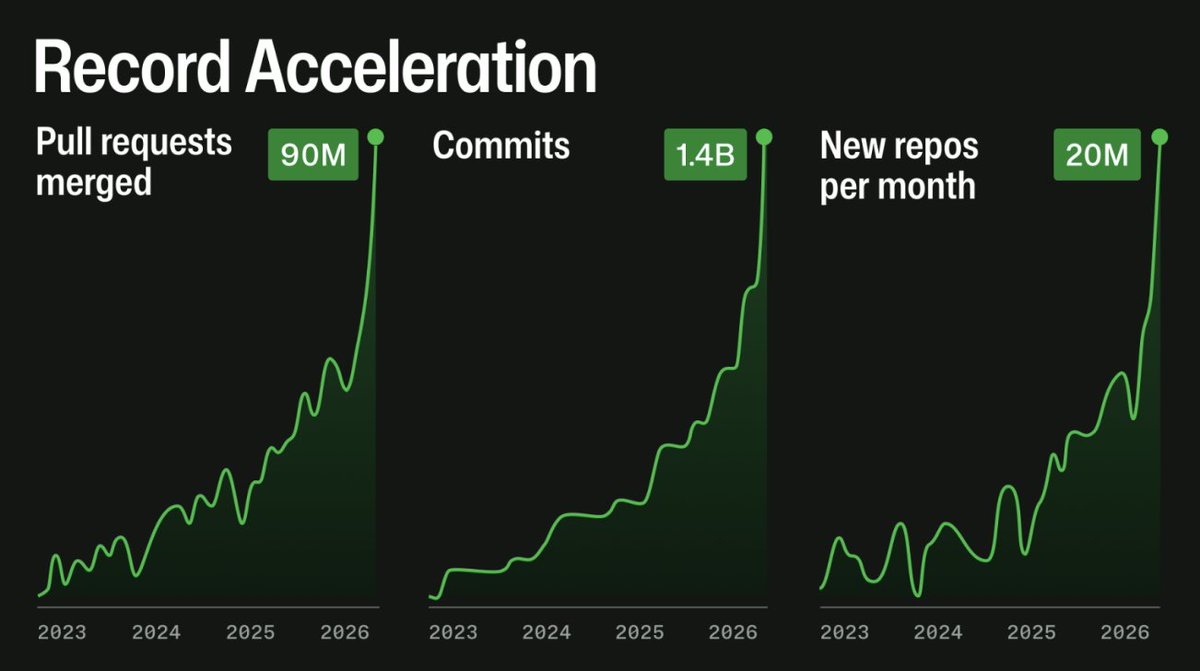
This chart - coming from GitHub is hard to interpret, thanks to missing information. 1. Where does this chart start? Aka what are the values in 2023? Surely it's not 0. But is it e.g. 10M? 30? 50? 2. What are we measuring? Is it 90M PRs per months, 1.4B commits per month?
open on xViews and clicks count once per visitor per day. Clicks are opens of this post on X.