Press Space to continue
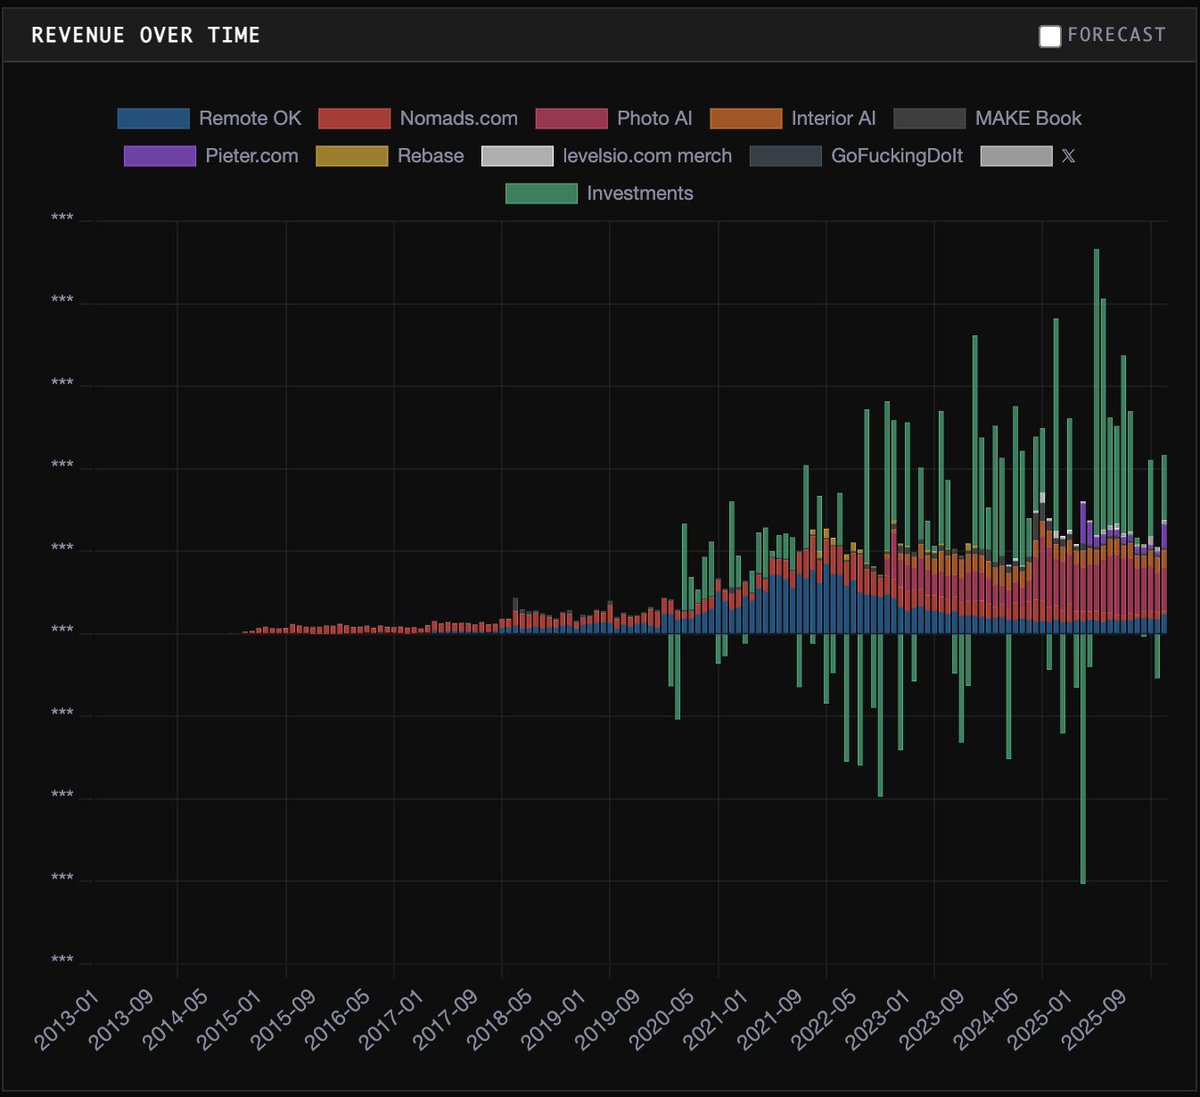
Investment returns now exceed project revenue some months
Press Space to continue

📊 Added live investment returns now to my revenue chart on my new 📡 Situation Monitor dashboard I built with Claude Code You can see the center bars are my projects revenue and then those green spikes are (mostly S&P500) investment returns Some months they very are up and I make more from investments than my projects (like 2025-05 about 3x more!) and other months they are down, meaning I actually lose money You can also see me start make money with Nomads .com (red), then Remote OK (blue),…
open on xViews and clicks count once per visitor per day. Clicks are opens of this post on X.